Roblox analytics dashboards directly impact user experience by providing developers with crucial data to identify and address pain points, optimize game design, and ultimately improve player engagement.
Understanding how players interact with your Roblox game is vital for success. Roblox analytics dashboards in user experience offer a clear view into player behavior. This allows you to see what works and what doesn’t.
With the insights, you can adjust gameplay, fix bugs quickly, and enhance overall enjoyment. Developers use these data points to fine-tune their creations and make them more appealing to players.

Roblox Analytics Dashboards in User Experience
Alright, let’s dive deep into something super important for making awesome Roblox games: analytics dashboards! These aren’t just boring charts and numbers; they are your secret weapon to understanding what players love (and don’t love) about your game. Think of them as a detective tool, helping you figure out where to make things even more fun. When we talk about user experience (or UX for short), we’re really talking about how a player feels when they’re playing your game. Are they having a blast? Or are they getting frustrated? Analytics dashboards show you all of that, but instead of just feelings, they show it to you as data, and with that, you can see the full picture of the game.
Why are Analytics Dashboards So Important for Roblox Game Creators?
Imagine trying to build a giant Lego castle without looking at the instructions. You might get something cool, but it’s probably not going to be exactly what you imagined, right? That’s how making a Roblox game is without analytics. You’re building in the dark, hoping players will like it. Analytics dashboards give you the instructions! They show you:
- Player Count: How many people are actually playing your game? When are they playing? This helps you understand your game’s peak times and popularity.
- Session Length: How long do players stay in your game? Are they hopping in for a quick look and leaving, or are they staying for hours? This tells you if your game is engaging.
- Where Players Struggle: Are players getting stuck at a certain part? Are they having trouble understanding a mechanic? The analytics help you see the problem areas.
- Popular Features: What do players spend most of their time doing? What areas are they exploring most? Knowing what’s popular helps you focus on what’s working.
- Monetization Performance: If you’re selling in-game items or features, analytics help you track what’s selling and what’s not. This can give you clues about what items players value most.
- Retention Rate: How many players return to play your game again after their first visit? This shows if your game has staying power.
Without this information, you’re just guessing. With it, you can make your game even better for your players. They can help you understand where players are spending time, where they’re having difficulties, and what aspects of the game they find most engaging, so you can make informed decisions about game design, updates, and more. By using data, you’re not just hoping players have fun; you’re actively making sure they do.
Understanding Key Metrics in Roblox Analytics
Okay, let’s talk about some of the important words you’ll see in your analytics dashboards. These might sound a bit complicated, but once you get the hang of them, they’re pretty easy to understand. They are the lifeblood of game analysis and user experience improvement. Here are some main ones:
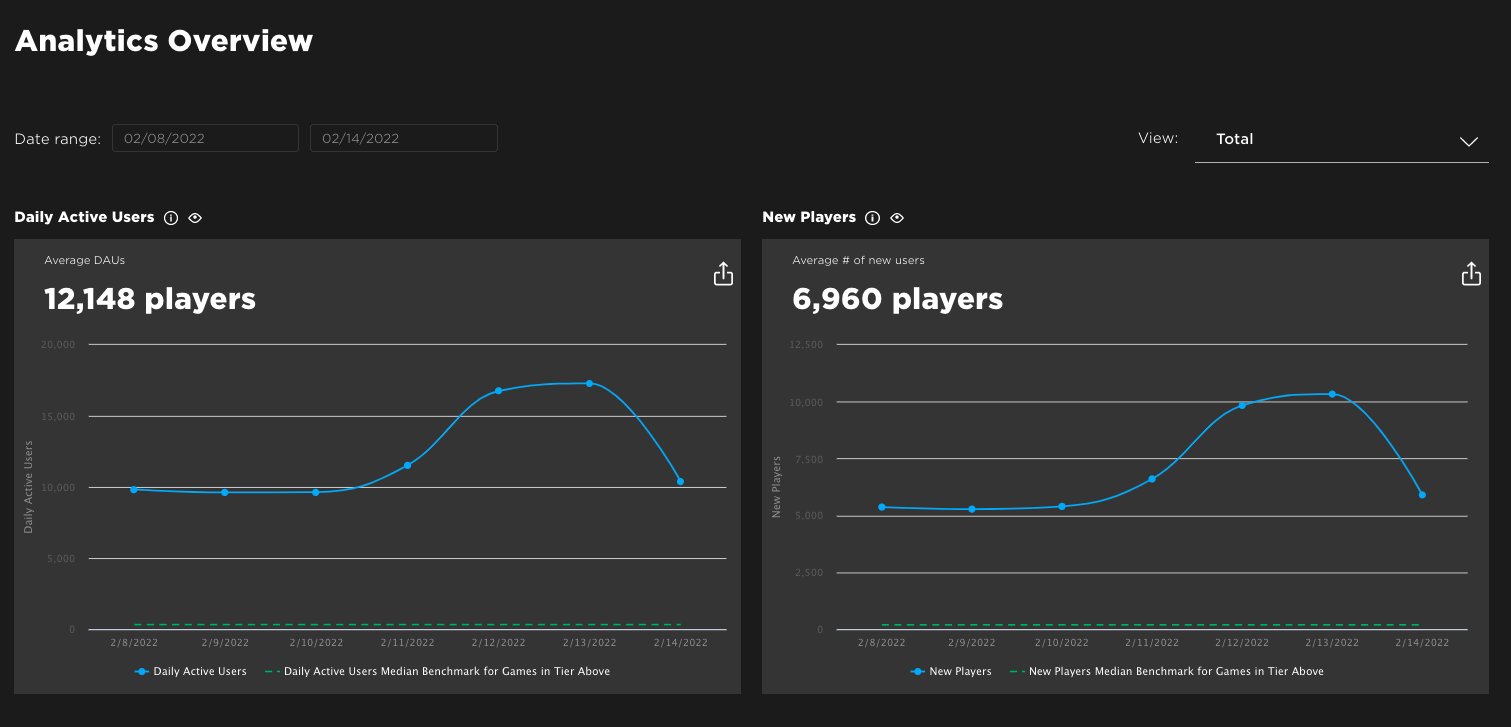
Daily Active Users (DAU)
This is how many unique people play your game on any given day. It is a very common metric and it’s one way of seeing how popular your game is every day. A higher DAU number means more people are playing! If you see a drop, that means you should try to analyze the root cause.
Monthly Active Users (MAU)
This is similar to DAU, but it shows how many different people play your game in a month. This gives you a wider view of your player base. Is it growing? Is it shrinking? MAU will let you know.
Average Session Length
This shows you how long players usually stay in your game each time they play. If the average is short, you might want to think about adding something that will make them want to stay longer or make changes to certain frustrating mechanics.
Retention Rate
This is the percentage of players who come back to play your game again after their first time. A high retention rate is awesome; it means people like your game! A low retention rate indicates some issues that need addressing, because the players are not coming back to your game.
Conversion Rate
If you have in-game purchases, this is the percentage of players who actually buy something. If it is low, then you should look at the prices or if the players are not liking the items you are selling.
Player Churn
Player churn, on the flip side of the retention coin, looks at the percentage of players who stop playing your game over a certain period. It’s not a fun number to track, but it’s an essential one, a high churn rate might signify a lack of compelling content or unaddressed game issues.
These are some of the common metrics that will help you better understand your game and your players. Remember, you can’t fix problems if you don’t see them and these numbers help see the problems and solve them.
Using Dashboards to Improve User Experience
Okay, so we have all this data now. How do we actually use it to make our games better? Here are some real-world examples:
Example 1: Identifying a Difficult Level
Let’s say you notice that many players are leaving your game at Level 3. Looking at your analytics, you see a big drop in session length at that level. This tells you that something in Level 3 is probably too hard or not fun. Maybe the puzzles are too confusing, or the enemies are too strong. With this info, you can go back and adjust the level, making it easier or adding clearer instructions. When you launch your changes, keep an eye on your analytics dashboard to see if things have improved.
Example 2: Enhancing Popular Features
Your analytics show that players spend most of their time in the building section of your game. That’s great! This means they really enjoy that feature. You could add even more building options or make it easier to share player creations. It’s like giving players more of what they already love, by looking at this you can provide even better experiences to the players.
Example 3: Monetization Strategies
You introduce a new type of hat for sale. But nobody buys it. Your dashboard tells you this is the case. Maybe the hat is too expensive? Or players just don’t like the look of it? The data gives you a chance to experiment with the price or the hat design until it starts to sell well. It can also provide insights into which types of items are popular, which can help with future item designs and releases.
Example 4: Understanding Player Flow
Analytics can help you understand the flow of players in your game. Are there areas where players get lost, confused, or sidetracked? Knowing this can help improve navigation and make your game more intuitive to explore. For example, a heat map can help show where players are moving the most and where they are getting stuck.
Example 5: Game Updates and Testing
With analytics, you can also see how players react to changes and new features in your game. This helps with testing new updates, making sure the game is enjoyable after new updates, and to make sure the updates do not have any bugs.
Types of Roblox Analytics Dashboards
There are many ways that you can see your analytics, and they range from Roblox’s own dashboards to third party companies dashboards, which might offer more features. Here are some of them:
Roblox Creator Dashboard
Roblox has its own built-in analytics dashboard for every creator! This dashboard provides a good starting point, and is also free to use! It shows you basic information like player count, session length, and the devices players are using. It’s a simple but useful tool to get you going. You can access this dashboard directly from your Roblox account. It gives you an overall view of your game’s performance, without having to use third-party tools.
Third-Party Analytics Platforms
For more advanced data analysis, you might consider using third-party platforms. Some of these tools can provide detailed heat maps, funnel analysis, and custom reports. They are very helpful if you want more detailed reports for your games. These tools usually have more advanced customization options and more metrics, so you can analyze your game in very different way.
Custom-Built Dashboards
If you have advanced coding knowledge, you can also build your own dashboards using Roblox’s API, or through third party APIs. It will let you customize your dashboards with the exact data you want to see. This allows creators to tailor their analytics to very specific needs.
Best Practices for Using Roblox Analytics Dashboards
Here are some tips to get the most out of your analytics data:
- Check Your Dashboards Often: Don’t just look at your dashboards once in a while. Make it a habit to check them regularly, especially after game updates. By constantly checking the dashboards, you can quickly notice if anything is wrong or if something has improved.
- Compare Time Periods: Look at how your numbers change over time. Compare today with yesterday or this week with last week to spot trends. You will start seeing patterns, and you will better understand your game with that.
- Set Goals: Have specific goals you want to achieve with your game. Do you want to increase session length? Or get more player purchases? Analytics help you measure your progress. If you don’t set goals, you will just look at the numbers, and not understand the purpose of checking them.
- Don’t Get Overwhelmed: There’s a lot of data out there. Focus on the metrics that matter most to you and your goals. Start with the most important and gradually incorporate the other ones.
- Share with Your Team: If you’re working with others, share your data findings with them so everyone can help. Sharing information can lead to better insights.
- Iterate Based on Data: Always be ready to make changes to your game based on what your dashboards are telling you. Your dashboards are the main tool to make your game even better!
- Always keep learning: Game development is a continuous learning experience, and analytics are there to help you in your process. Keep up to date with the newest metrics to better understand the changes in your game.
Making Data-Driven Decisions
Remember, the main purpose of these dashboards isn’t just to look at numbers, it’s to make informed decisions about your game based on what you are seeing in them. This is a critical part of game development. The use of analytics helps you see your game from the players perspective. You can then make changes to fix problems that they are facing or increase the enjoyment with popular features. It’s a continuous cycle of observing, learning, and improving.
By paying close attention to your Roblox analytics, you can create better gaming experiences, keep your players engaged, and continuously improve your game’s performance. This allows you to make informed choices that will lead to more successful games. Making data-driven decisions ensures that you are constantly adapting and improving, which is crucial for success on Roblox platform.
In conclusion, Roblox analytics dashboards are crucial for understanding your game’s user experience. They provide invaluable insights into player behavior, preferences, and pain points, allowing you to make informed decisions that improve your game’s performance and player satisfaction. By paying attention to your metrics, setting goals, and acting on the insights you gather, you can continue to create amazing experiences for your Roblox players.
How To Use The New Roblox Creator Dashboard
Final Thoughts
Roblox analytics dashboards directly impact user experience. Clear data visualizations help developers understand player behavior. They show which game elements engage players most, and where they might struggle or leave.
Using this feedback, designers can tweak gameplay to improve player retention and satisfaction. Effective roblox analytics dashboards in user experience are therefore crucial for creating successful and enjoyable games.

