
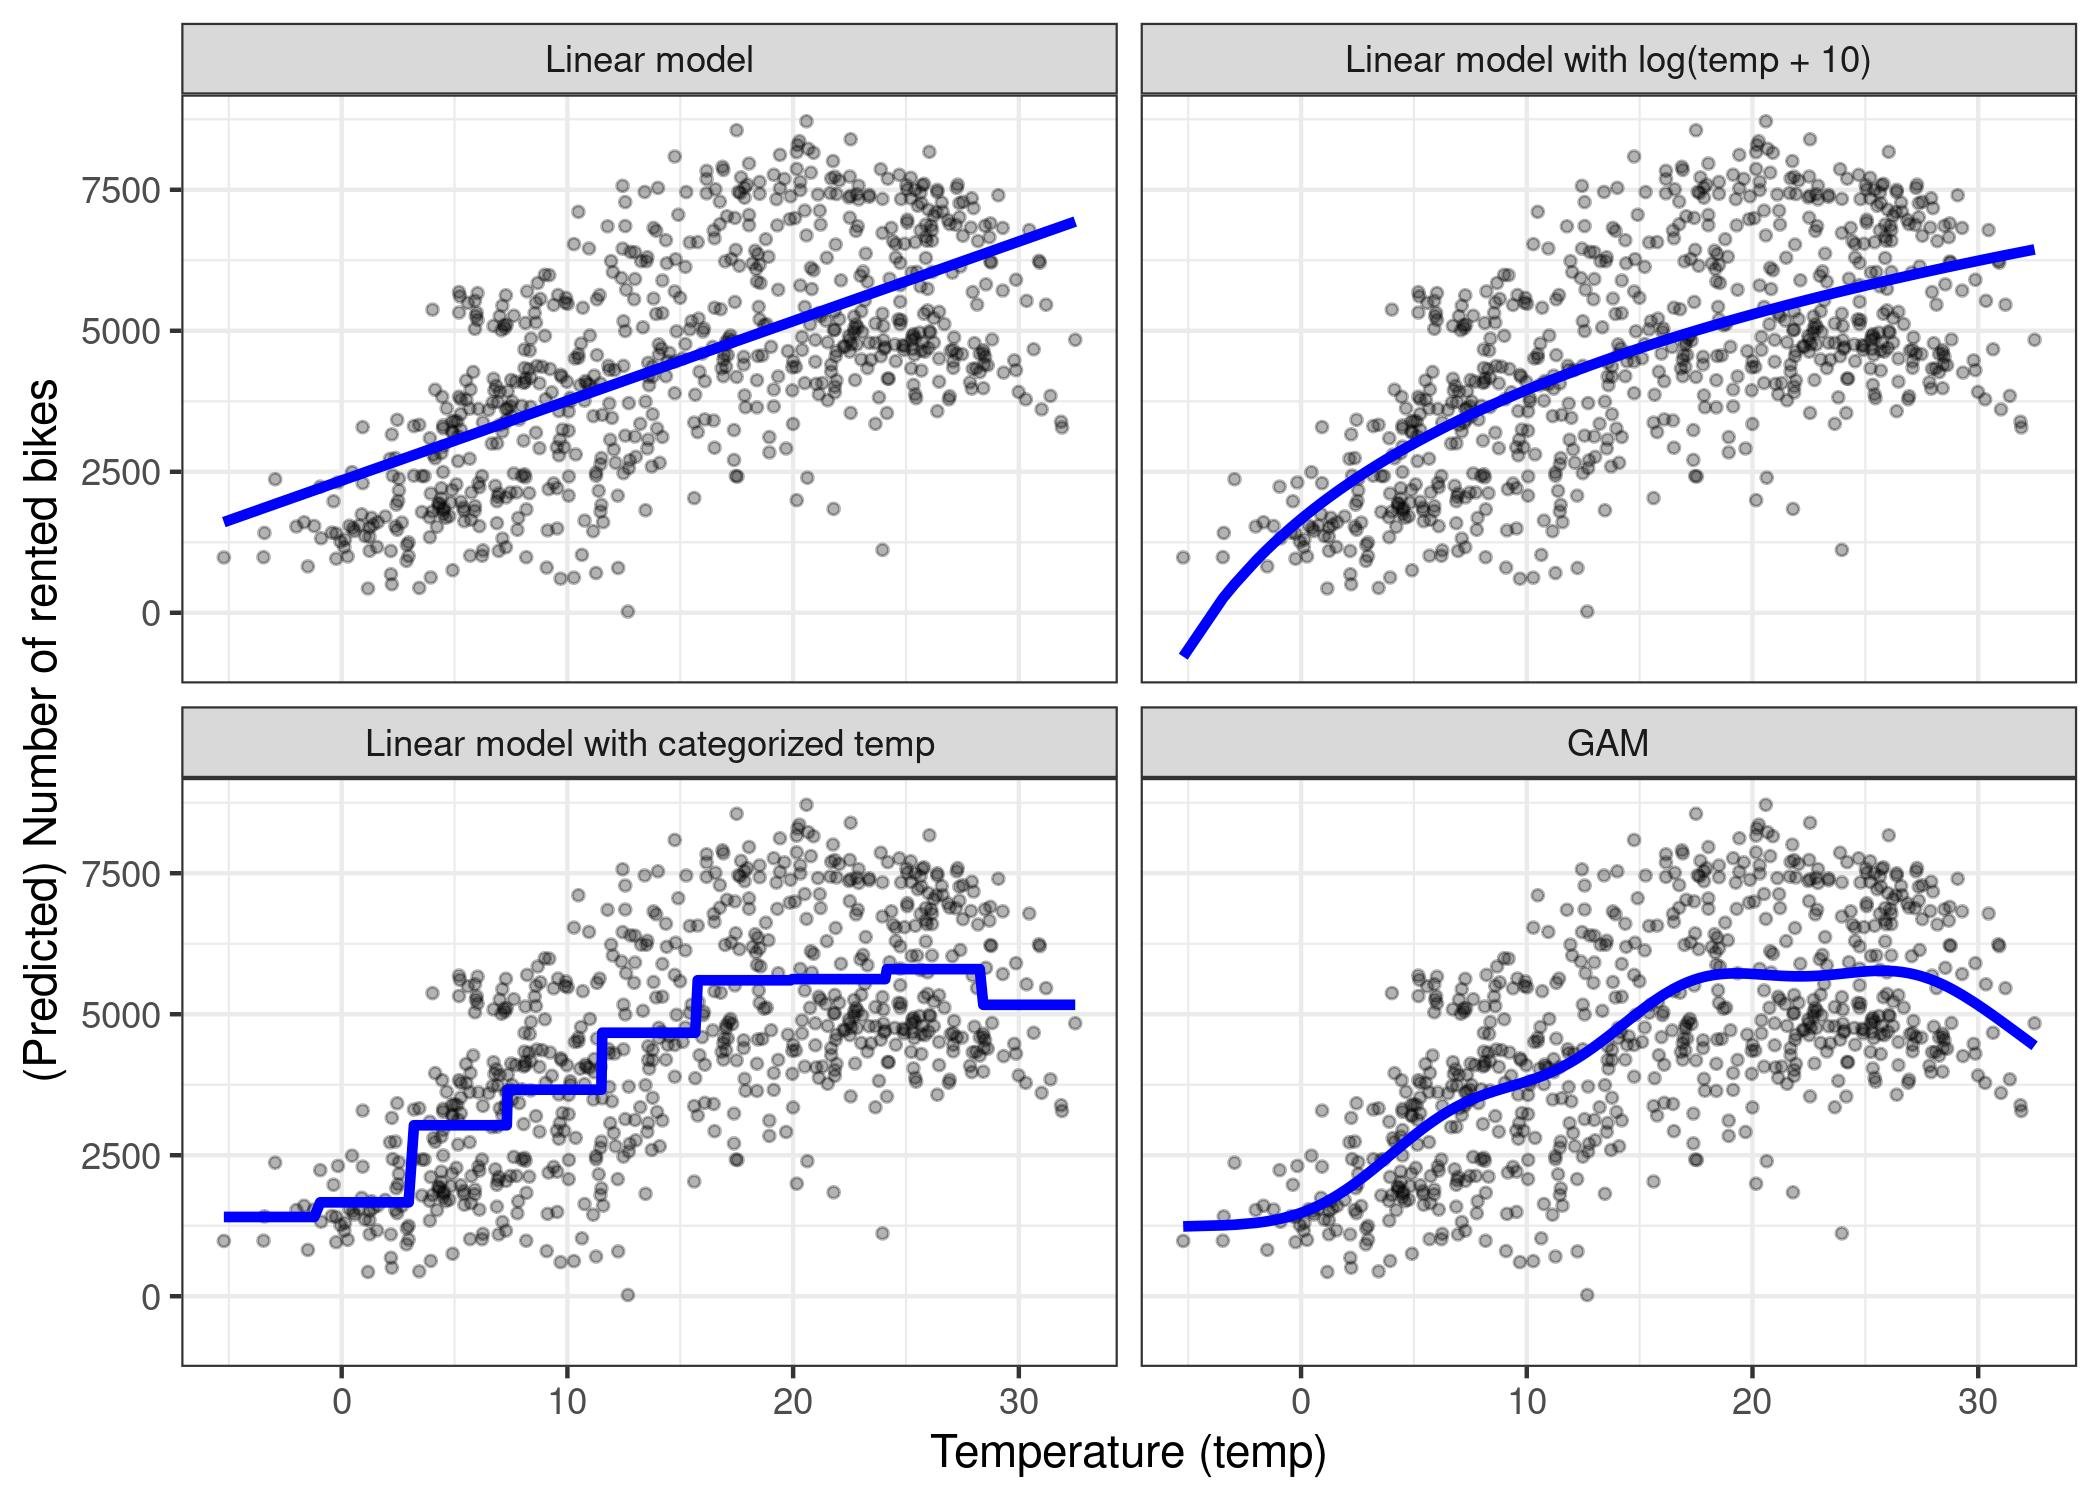
The key difference between GAM and GLMM lies in how they model relationships: GAMs use smooth functions to capture non-linear effects of predictors, while GLMMs use random effects to handle correlated data, often due to hierarchical structures.
Navigating the world of statistical modeling can feel like a maze, especially when encountering terms like GAM and GLMM. What is the difference between GAM and GLMM in statistics? These two powerful techniques offer distinct ways to model data, and understanding their core differences can greatly enhance your analytical toolkit.
Generalized Additive Models (GAMs) excel at capturing non-linear relationships between predictors and the response variable. They achieve this by using smooth functions. On the other hand, Generalized Linear Mixed Models (GLMMs) specifically address data with dependencies. They incorporate random effects to account for such correlations. These different approaches make them suitable for different data and research questions.

What is the Difference Between GAM and GLMM in Statistics?
Okay, let’s dive into the world of statistics! We’re going to explore two cool tools: GAMs and GLMMs. These aren’t your everyday average calculations; they’re used when things get a little more complicated than just simple relationships between things. Imagine you’re trying to figure out how much a plant grows. Maybe it depends on how much sun it gets, but maybe it also depends on the type of soil, or even how much it rained last week! That’s where GAMs and GLMMs come in, but they handle these complexities in slightly different ways. So what makes them unique?
Understanding the Basics: What are GAMs?
Let’s start with GAMs, which stands for Generalized Additive Models. Now, that sounds like a mouthful, right? Don’t worry, let’s break it down. Think of a regular math equation, like y = 2 x + 5. Here, the relationship between ‘x’ and ‘y’ is straight line. GAMs are special because they can handle relationships that are not straight lines. Instead of the standard linear relationship, GAMs use ‘smooth functions’. Think of a curvy line. This curvy line isn’t made up of straight segments, but a smooth curve that fits the relationship you are trying to understand between your variables.
Key Features of GAMs
- Flexibility: GAMs are super flexible. They don’t force you to say that a relationship between variables is only linear (a straight line). Instead, they are happy to deal with curves and other non-linear shapes.
- Additivity: The “additive” part means that the GAM builds its model by adding up different smooth curves. Each smooth curve relates to one variable at a time, and each function is then combined to predict the outcome.
- Generalized: The “generalized” part means that they can work with different types of outcome variables (not just the usual straight line). For instance, you can use GAMs to model probabilities, counts, or any kind of outcome that fits a distribution.
- Smooth Functions: GAMs use “smooth functions” (splines) to model the relationship between the variables and the outcome. These curves are flexible and can adjust to the data without being too wiggly.
Imagine you’re studying how temperature affects the number of ice cream cones sold at a beach. With a GAM, you could see that the relationship isn’t a simple straight line, where more heat always equals more cones; maybe it curves up with the temperature increasing initially, but then starts to level off once it gets too hot because nobody wants to eat melting ice cream. A GAM can capture this kind of pattern.
Delving into GLMMs: What are they?
Okay, now let’s talk about GLMMs, or Generalized Linear Mixed Models. These are another powerful tool, but they add a different layer of complexity than GAMs. GLMMs are used when we need to consider groups or clusters within the data. Think about it like this: let’s say you want to study how well kids do in school. You might have kids from different schools, and some schools might be generally better than others. GLMMs allow you to account for the differences between groups. It recognizes that some groups may have different starting points that affect all of their scores and helps us focus on the individual differences with the knowledge of group differences.
Key Components of GLMMs
- Fixed Effects: These are the things you are most interested in studying; they are the main things that are changing that you believe cause a change in your outcome. Continuing with the school example, these could be the teaching methods, class size, student background, etc. These are the effects that you’d like to examine carefully.
- Random Effects: These are the things that make up the different groups. In the school example, these are the differences between the schools, the different teachers, or different classrooms, for example. They are not the main focus of your study but something that you know is causing variation in the data, and you want to account for.
- Generalized: Like GAMs, GLMMs can handle different types of outcomes.
- Linear: The relationship between the predictor variables and the outcome is typically linear, although you can use various transformations of the predictor variables to capture non-linear patterns in the data.
In our school example, a GLMM could tell you if the teaching method really makes a difference for the kids, while also taking into account that some schools are higher performing than others. This is what the random effect takes care of.
The Core Difference: Flexibility vs. Hierarchy
The primary difference between GAMs and GLMMs is how they handle complexity. GAMs excel in modeling complex non-linear relationships between variables, while GLMMs shine when dealing with hierarchical or clustered data. Think of it this way:
GAMs: The Curve Masters
- GAMs are like artists, they’re focused on making the relationship between variables as smooth and as accurate as possible. They do this by creating flexible, curvy lines that fit the data.
- They focus on the shape of the relationship between your predictors and the outcome.
- They’re less concerned with the grouping of your data and don’t explicitly account for nested groups like different schools.
GLMMs: The Group Managers
- GLMMs are like organizers, they’re good at organizing the data into groups and accounting for the differences between them. They focus on the impact of different groups.
- They understand that groups can be different from each other and account for this in the analysis.
- They focus on the linear relationships between variables and may need transformations to capture non-linearities.
To illustrate, imagine trying to predict the weight of a dog. A GAM would be very useful if you thought the age of the dog and its weight weren’t linearly related – that is, young puppies might grow quickly then the rate of growth slows down as they age. A GLMM would be great if you had dogs from different breeds and wanted to account for the fact that certain breeds are heavier than others.
When to Use a GAM
You would want to use a GAM in cases where you suspect non-linear relationships between your predictor variables and your outcome. The outcome variable can be a number (like height) or a binary result (like having a disease vs not having it), for instance. Let’s look at some situations where GAMs are ideal:
Example Scenarios for GAMs
- Predicting plant growth: If you believe there is a non-linear relationship between the amount of fertilizer and plant growth (too much fertilizer can actually hurt growth), a GAM would be helpful.
- Analyzing weather patterns: Understanding the complex relationship between temperature, humidity, and rainfall requires the smooth curves that GAMs excel at.
- Modeling dose-response relationships: When you need to understand how the amount of a drug changes its effect on the body, the relationship is not always linear.
- Understanding seasonal trends: If you want to see how sales of a particular product change over the year, you can model this type of cyclical pattern using a GAM.
- Spatial Data Analysis: When looking at the relationship of some factor across a geographical space, such as animal density or disease prevalence, GAMs can incorporate spatial smoothing effects.
When to Use a GLMM
GLMMs are best to use when your data has a group or a hierarchy in the data. For instance, if you are collecting data in multiple places, you would want to account for the fact that there could be some differences in the way that things work in those different places. Here are examples of when to use a GLMM:
Example Scenarios for GLMMs
- Studying Student Performance: If you are looking at how teaching methods affect student test scores, you might want to account for differences in the school districts or individual classrooms.
- Medical research: If you have multiple patients from different hospitals, accounting for potential hospital effects with a GLMM might be beneficial.
- Ecological studies: If you’re tracking wildlife across different locations, a GLMM could help account for the differences between habitats, or between the individuals being tracked.
- Longitudinal Studies: If you are measuring changes in a subject over time, you will often want to account for the repeated measures within each subject.
- Market Research: When sampling from different regions, you may want to account for the location when assessing product preferences.
What About Overlapping Usage?
It’s worth noting that GAMs and GLMMs aren’t mutually exclusive, and there can be situations where they overlap. For example, you could have hierarchical data with non-linear relationships. In such cases, you could apply a GAM within a GLMM. This is sometimes referred to as a GAMM (Generalized Additive Mixed Model). These are the most advanced models that try to do both of the things described above. These models are generally difficult to interpret, however, so these models should only be used in very specific cases.
Combining Approaches
- GAMM (Generalized Additive Mixed Model): These models are the most comprehensive. They can accommodate both non-linear relationships and hierarchical or grouped data.
- Use Case Example: A study of tree growth that looks at how climate affects growth using a non-linear smooth function, but which also accounts for data from different tree species or different forests.
Technical Differences Explained
Now, let’s dive a little deeper into the technical differences between GAMs and GLMMs. This might seem a little complicated, but we will break it down to make it easy to understand.
GAMs: A Closer Look
- Splines: GAMs use splines (smooth curves) to represent the relationship between variables. These splines have ‘knots’ that let them change direction and fit the data well. The more knots there are, the more flexible the line is.
- Smoothing: To prevent these flexible lines from becoming too wiggly, GAMs incorporate a smoothing parameter. This parameter controls how smooth the relationship is and prevents over-fitting the data. Over-fitting happens when your model captures the data too closely, even the noise in the data, which makes it perform poorly when given new data.
- Estimation: GAMs use special mathematical techniques to figure out the best-fitting curves. This process often involves iterative algorithms, which means they solve equations step-by-step until they find a solution that fits the data well.
GLMMs: Under the Hood
- Variance Components: GLMMs try to determine how much variation in your data comes from the individual groups (random effects). They do this by estimating “variance components”, which are basically the amount of spread in your data between groups.
- Linear Predictor: Unlike GAMs, GLMMs typically use a linear predictor. This means the predictor variables combine linearly to determine a value.
- Likelihood Function: The method of parameter estimation is via maximizing a likelihood function. Likelihood functions mathematically represent the probability of observing the data given the model. GLMMs seek to find the set of parameters (the fixed and random effects) that make the data most probable.
- Estimation Techniques: Estimating GLMMs involves techniques like iterative re-weighted least squares (IRLS), or more complex methods depending on the situation.
Simplified Comparison: GAM vs GLMM
To sum it up, here is a table that makes a simple comparison of the two model types:
| Feature | GAMs (Generalized Additive Models) | GLMMs (Generalized Linear Mixed Models) |
|---|---|---|
| Main Focus | Modeling non-linear relationships | Accounting for group structure and hierarchies |
| Relationship Between Variables | Flexible, non-linear using smooth functions | Linear, though transformations can be used to approximate non-linearities |
| Handling of Data Structure | Not explicitly handle grouping | Explicitly handles hierarchical or clustered data (random effects) |
| Typical Use Cases | Dose response, trends over time or space, complex relationships | Studies with grouped data, repeated measures, hierarchical structures |
| Statistical Method | Fitting smooth splines and estimating the best smooth function | Estimating fixed and random effects using various estimation techniques |
Hopefully, this detailed explanation clarifies what makes these two models different and when you might use each one.
In short, GAMs are your go-to choice when your data’s relationships curve and bend, needing a flexible approach to modeling the relationship, while GLMMs are essential when you need to handle nested groups or hierarchy in your data, acknowledging that data points from the same groups might be more similar to one another than to data from other groups. Both are powerful tools, but they help you tackle different kinds of statistical questions.
GLM vs. GAM – Generalized Additive Models
Final Thoughts
Generalized additive models (GAMs) and generalized linear mixed models (GLMMs) differ fundamentally. GAMs model non-linear relationships between predictors and the response, using smooth functions. GLMMs, on the other hand, incorporate random effects to account for data dependencies.
The key difference between GAM and GLMM in statistics lies in how they handle non-linearity and dependence. GAMs focus on flexible curve fitting, while GLMMs address hierarchical data structures. One addresses predictor variable’s influence, and the other handles data clustering.

